Goal: When you have finished this laboratory exercise you will understand
- significance of brining
- effect of temperature and brine concentration on the brining process
and you will learn to
- how to determine the effective diffusion coefficient from experimentally obtained data of salt concentration in blocks of cheese.
- how to determine the effect of temperature and brine concentration on the effective diffusion coefficient.
-
Salt in cheese serves three major functions: it acts as a preservative, contributes to flavor and provides a source for sodium which is important in regular diet.
There are three principle methods used in salting cheese:
- Dry salting - direct addition and mixing of dry salt crystals
- Surface dry salting - rubbing of dry salt or salt slurry into the surface
- Brine salting, brining - immersion of cheese in brine solution
-
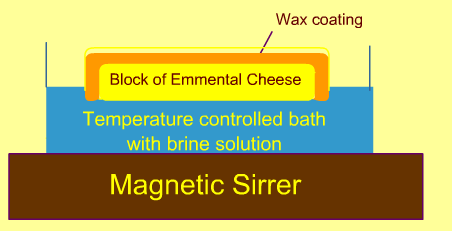
Cylindrical blocks of Emmental cheeses (13 cm in diameter and 20 cm in height), obtained from a cheese manufacturer, will be used in the experiments.
Before the brining experiments, the cylindrical surfaces of the cheeses will be covered with paraffin to prevent dehydration of the samples during the long brining process.
It is also important to control the pH and calcium content of the brine solution. For this purpose, calcium chloride is added to the brine, and the pH is adjusted by addition of lactic acid. For this experiment, calcium chloride, in a concentration of 300 g/L, is added into the brine, and pH of the brine is adjusted to 5.4 by addition of lactic acid. -
Brining experiments are carried out a shown in the figure by holding the cheese sample's planar surface inside the continuously agitated brine.
-
At periodic time intervals, the cheese samples are slided into 1 mm thickness, at the surface and at 1 cm from the surface to measure the NaCl content.
The NaCl content is deduced from measuring the chloride ions after extraction from the 1mm thick cheese samples. The chloride ions are quantified by using a chloride analyzer.
The moisture content of the samples is estimated by placing ≈5 g crushed sample of cheese in an oven set at 102oC until the sample reaches a constant weight.
-
Brining e.g. salt addition is an important operation in the cheese making process since the amount of salt determines textural and sensory properties of the cheese.
During brining, salt it absorbed from the sodium chloride(NaCl) solution, called brine, into the cheese resulting in an increase in the NaCl concentration in the cheese and water loss.
This results in a significant salt and moisture gradients from the surface to the center of the cheese. -
In this experiment, we will determine the effective diffusion coefficient value (D) of NaCl inside the Emmental cheese samples.
For this purpose, the following analytical solution will be used: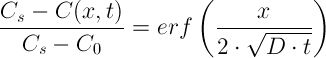
This solution is valid when the mass transfer of NaCl in a sample of cheese is 1-dimensional. Therefore, the experimental methodology will be adjusted accordingly.
-
In the experiments, the measured salt concentration in the surface layer and 1 cm from the surface of the cheese sample, will be used to determine the diffusion coefficient of the salt in the cheese sample.
To determine the diffusion coefficient from the given equation, use of the error function (erf), a trial and error methodology, and application of the Goal Seek procedure in Excel will be used.
-
In this laboratory exercise, you obtained data on salt concentration of cheese sample at its surface and 1 cm from the surface.
To determine the diffusion coefficient of salt in the cheese sample, we will use the following equation with a trial and error procedure: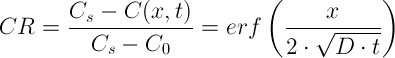
1. Copy an experimentally obtained NaCl content data (either surface or at 1 cm from surface) in a new Excel file.
2. In a new column, determine the concentration ratio CR values, and plot them versus brining time: -
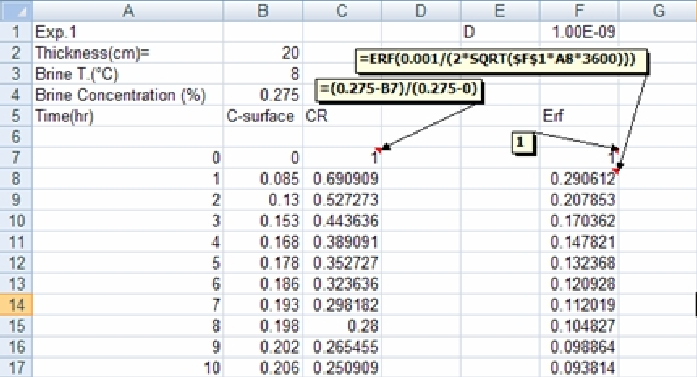
3. In cell F1 (above figure), enter a guess effective diffusion coefficient value, e.g. 1E-9 (this is 10-9 expressed in the required format for Excel).
-
4. Determine
 versus brining time in column F. For use of the erf(error function), see Chapter 1.7.
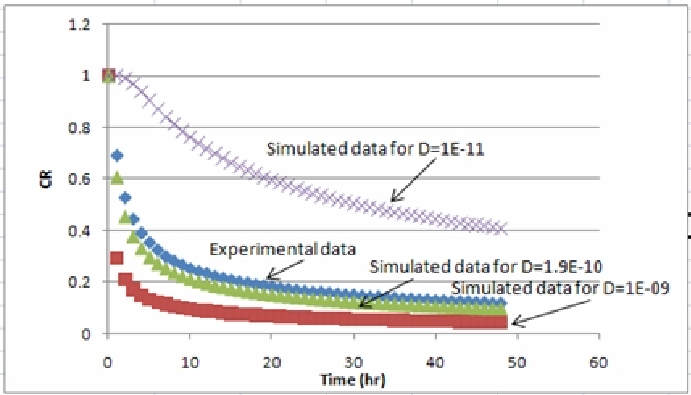
5. Create plots of the experimental (from step 2) and simulated (from step 4) CR values and compare them visually (see the following figure). If the simulated values were following a lower trend compared to the experimental data, you need to decrease your guessed effective diffusion coefficient value or vice versa.
6. Repeat step 3 to 5 until a reasonable visual agreement between the experimental and simulated results is obtained. -
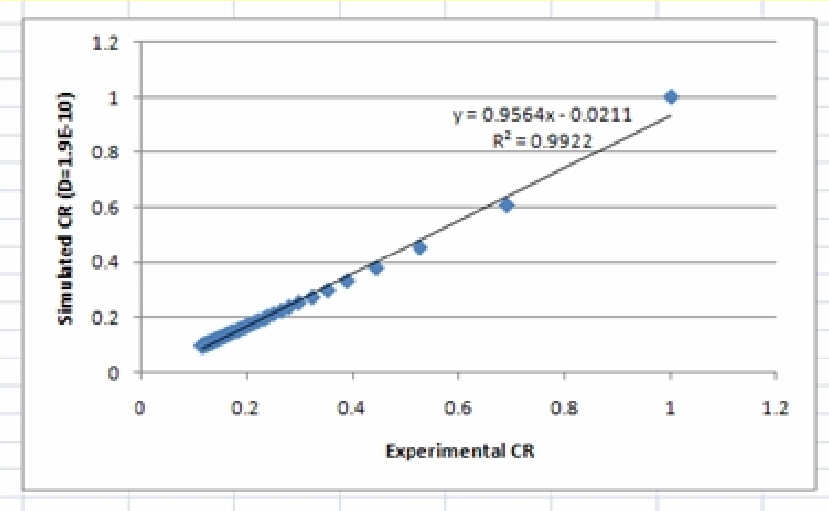
7. Determine the correlation between the experimental and simulated CR values using the Trendline option.
-
-
The Goal Seek option may also be used in this analysis. In this experiment, since we have a set of data, any of the experimental data value can be our Set Cell box while the corresponding CR value is the To Value box. The By Changing Cell will be then the diffusion coefficient cell.
As shown in spreadsheet, we want to get a value, for example in the cell F8, of 0.29061. Hence, the cell F8 can be chosen to be the Set Cell Box while the To Value Box is in cell C8(0.69091 as the corresponding value to F8). In this case, the By changing Cell will be cell F1. If you apply the Goal Seek option using these cells, the result will be given in cell F1.
- What is the unit of the effective diffusion coefficient value you determined?
- Did the effective diffusion coefficient values change with respect to the experimental data obtained at different locations in the cheese sample? Would you expect them to be different? Why?
- How would you expect the effective diffusion coefficient values to change with brine temperature or concentration?
- Would the results be different if we used a rectangular cheese sample instead of a cylindrical one under the same experimental conditions? Why?
- Would we obtain different results if we used cheddar cheese instead of Emmental cheese for the same experimental conditions?
- How did the effective diffusion coefficient value change with an increase in the concentration and/or temperature of the brine? Is this change as you expected? Explain.
- Gros, J.B. and Ruegg, M. (1987). Determination of the apparent diffusion coefficient of sodium chloride in model foods and cheese. In: F. Jowitt, B. Escher, M. Kent, B. McKenna, and M. Rogues. (Eds.), Physical Properties of Foods-2 (pp.71-108). Elsevier Applied Science. London, UK.
- Guinee, T.P. (2004). Salting and the role of salt in cheese. Int. J. Dairy Tech., 57:99-109.
- Luna, J.A. and Chavez, M.S. (1992). Mathematical model for water diffusion during brining of hard and semi-hard cheese. J. Food Sci. 57:55-58.