Goal: When you have finished this laboratory exercise you will understand
- how fruits and vegetables are cooled prior to shipment
and you will learn
- the mechanism of het transfer during hydrocooling
- how to describe cooling time when fruits and vegetables are hydrocooled
-
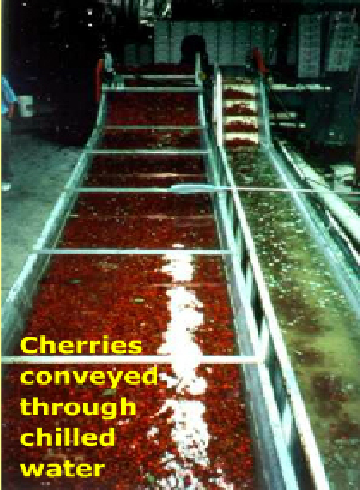
Hydrocooling is used for a variety of fresh fruits and vegetables. The following photograph is of an immersion water cooler used to cool cherries.
-
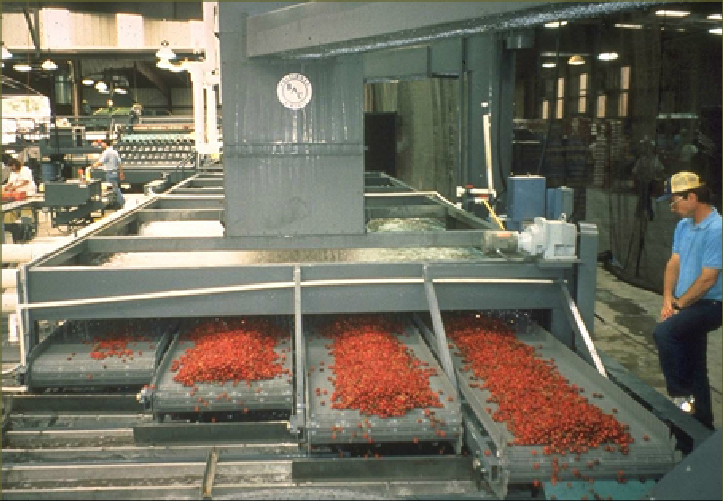
A spray-wash cooler used to cool cherries.
-
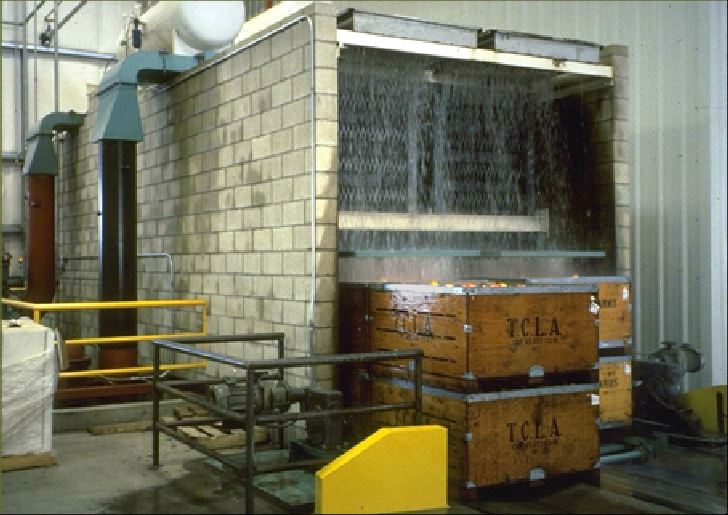
A spray cooler for product in bins.
-
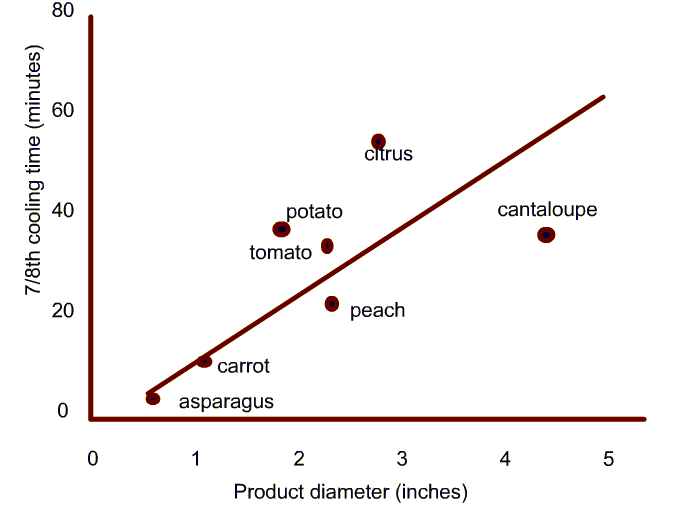
Typical cooling times measured in industrial hydrocoolers.
-
In a laboratory experiment, we will use two products, melon and cherries. The procedural steps are as follows:
1. Measure product size using calipers.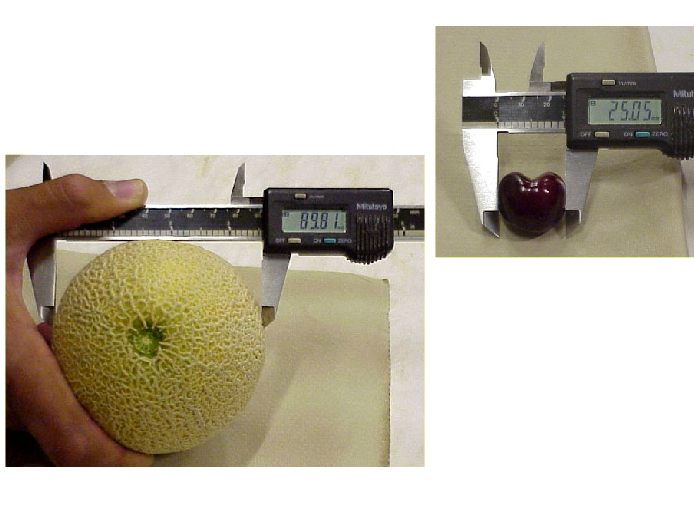
-
2. Measure internal temperature of the given product.
Use a thermocouple inserted to the center to measure center temperature.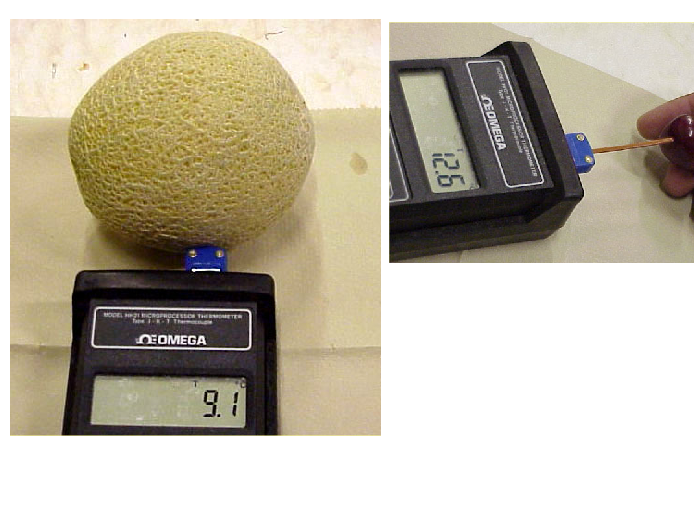
-
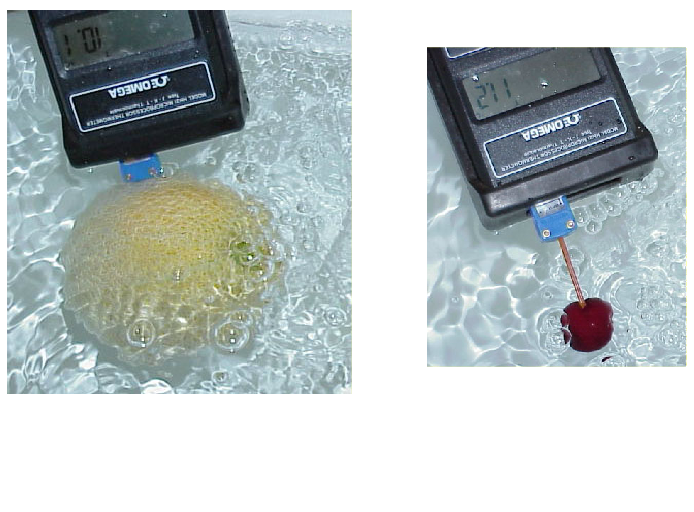
3. Immerse product in the constant-temperature water and record product temperature.
-
In the virtual experiment, first select either melons or cherries and input the respective diameter. Then select initial product temperature, final product temperature, water temperature, and the velocity of the cooling medium. In addition, decide whether the final cooling is to be based on a mass average temperature or center temperature of the product being cooled. The results will include a plot of temperature vs. time and the data will be saved in a spreadsheet.
-
Fruits and vegetables must be cooled soon after harvest to reduce the rate of respiration. A common method used in the industry for this purpose involves either immersing or spraying the product with chilled water. During hydrocooling, the product cools as it comes into contact with chilled water. Heat transfer is generally described as a conductive process inside the product and convective transfer of heat from the surface to water.
The temperature of the food is measured during the cooling time. The cooling rate is described by "7/8th cooling time", a term used in the food industry. In this laboratory exercise, you will learn how to calculate this parameter.
| t = | (s) |
-
In this experiment, you obtained temperature-time data for various size products cooled with different water temperatures. For each case, the results should have been saved in a spreadsheet file. Use the following steps to analyze the results.
Using temperature-time data to create plots of center and mass average temperature vs. time for each case. Compare each plot and discuss the effect of size, water temperature and product on temperature decrease. -
Calculate cooling rate for each temperature-time plot. Cooling rate is obtained by plotting log of unaccomplished cooling vs time and determining the slope.
A common parameter used in the industry is 7/8th cooling time. The procedure to calculate 7/8th cooling is as follows:
1. From the plot of mass average temperature vs. time, determine the ratio representing when temperature decrease by half of its initial value.
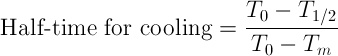
where To is initial temperature, T1/2 = (To - Tm)/2, Tm is cooling medium temperature.
2. Seven-eighth time is three times the half-time for cooling. -
3. An example of these calculations is shown below (Note: 7/8th cooling time is calculated only from mass average temperature data)
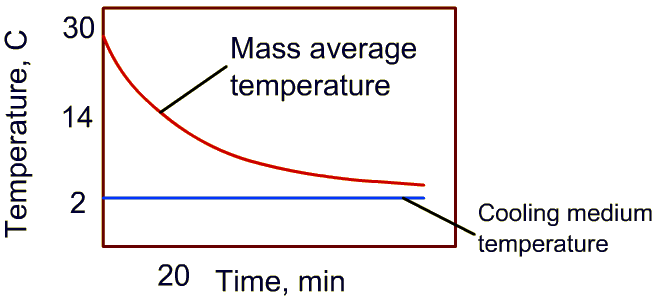
4. For the temperature-time plot shown, initial temperature is 30oC, the cooling medium temperature is 2oC. Then time required to reduce the temperature by half of the difference between initial product temperature and cooling medium is (30-2)/2 = 14oC
5. Identify 14oC on the temperature plot, and from cooling curve, determine the time. In this example, it is 20 minutes.
6. Multiply the time obtained in step 5 with 3 to obtain seven-eighth time. For this example, the answer is 60 minutes.
- Discuss how the product size influences the 7/8th cooling time.
- Why are the profiles of center temperature and mass average temperature different for any given product size?
- Discuss the role of cooling water temperature on the 7/8th cooling time.
- Thompson, J.F., Gordon Mitchell, F., Rumsey, T.R., Kasmire, R. and C.H. Crisosto. (1998). "Commercial Cooling of Fruits, Vegetables and Flowers," Publication 21567, University of California, Division of Agricultural and Natural Resources, Oakland, California.
- Kasmire, R.F. and Parsons, R.A. (1971). "Precooling cantaloupes, a shipper's guide," Agric. Ext. Service, University of California, Berkeley.
- ASHRAE (1990). "American Society of Heating, Refrigerating and Air Conditioning Engineerings guide and databook: Refrigeration," ASHRAE, Atlanta.