Goal: When you have finished this laboratory exercise you will understand
- the change in nutrient content in foods due to processing
and you will learn
- how to use kinetic analysis to examine changes in the nutritional content of a food
- how to describe first order kinetics
- how to obtain kinetic parameters, such as rate constant and the activation energy.
-
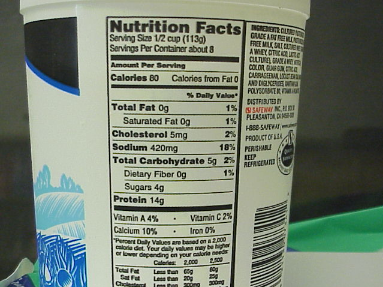
Nutritional labeling requires the food industry to provide information on nutritional content on the package label. For this purpose, it is common practice to measure data on the nutritional content as a function of time from shelf life studies. The influence of temperature on the rate kinetics is incorporated using Arrhenius equation.
-
In a laboratory experiment, we use orange juice since it has high levels of ascorbic acid. Small samples of orange juice are heated at three temperatures (90, 100 and 110oC). The ascorbic acid content is measured after the samples are processed.
-
In the virtual experiment, select any desired temperature. The result will include change in Q/Q0 with time.
-
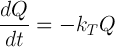
A change in a quality factor, Q, is described using a first order equation as follows:
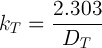
The relationship between the rate constant and D value is
And the dependence of kT on temperature is described by an Arrhenius expression:
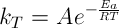
where Q is the quality attribute, kT is the rate constant, Ea is the activation energy, R is the gas constant, T is the absolute temperature, and A is the pre-exponential factor.
-
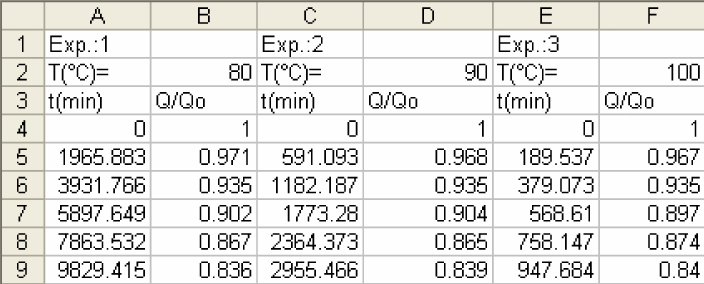
In this experiment, we collected data for decrease of ascorbic acid in orange juice in the form of Q/Q0 vs time as shown below. Note: Q0 is the concentration of ascorbic acid at time 0.
-
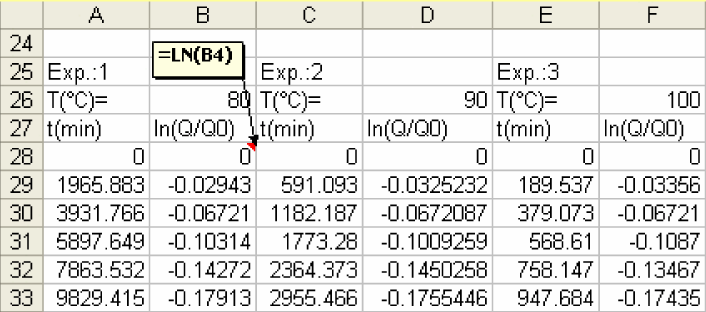
1) First, convert Q/Q0 into ln(Q/Q0)
-
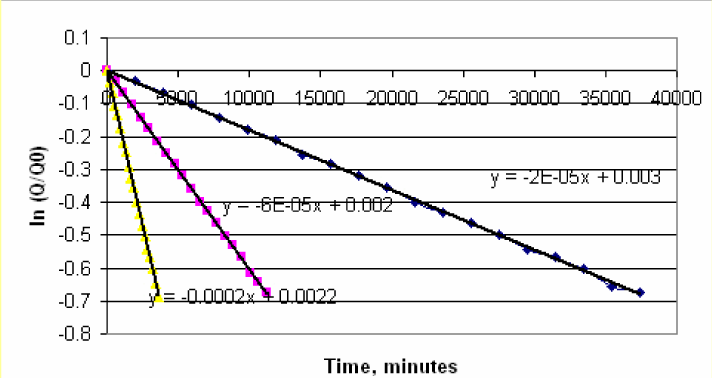
2) Create a plot of ln(Q/Q0) vs time. You will obtain a linear plot. Using Trend line determine the slope of the line.
-
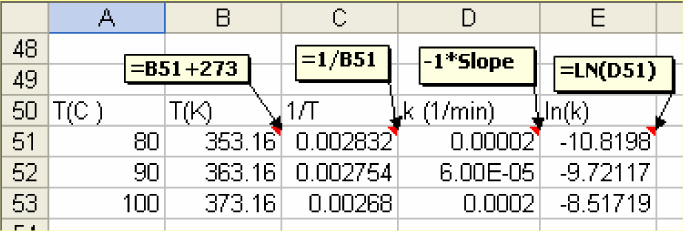
3) The slope from the plot gives k. Prepare a table as shown below, with temperatures converted into Kelvin and respective k values. Create an additional column (E) for ln(k).
-
4) Plot ln(kT). Using Trend line, determine the slope.
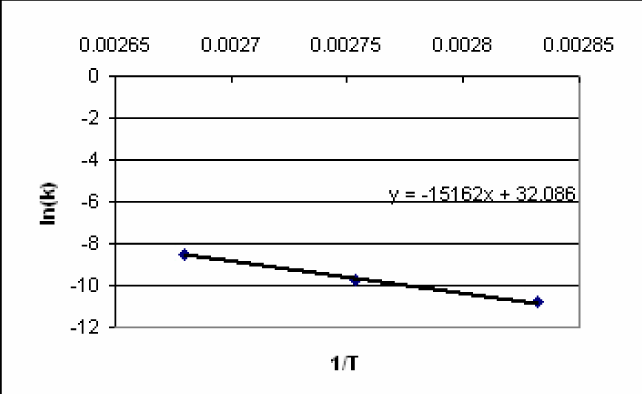
-
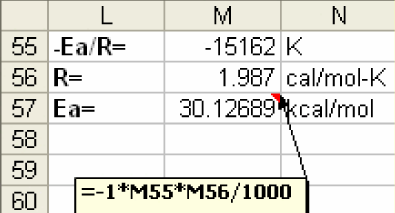
5) From the slope of the linear plot obtained in step 4, calculate Ea.
Determine the relationship between first order rate constant and D value. Calcuate D values from the results obtained in this exercise.
Show how z value may be calculated from activation energy. Calculate Z value from the results obtained in this experiment.
Determine the required time at 85 and 105oC for ascorbic acid to degrade 10% of its initial value in orange juice.
- Labuza, T.P. (1982). "Shelf-Life Dating of Foods," Food and Nutrition Press, Inc., Westport.
- Man, D. and Jones, A. (2000). "Shelf-Life Evaluation of Foods," 2nd ed., Aspen Publishers, Gaithesburg.
- Singh, R.P. and D.R. Heldman. (2009). "Introduction to Food Engineering," 4th ed., Academic Press, London.